This may not be the bubble you’re looking for
At great risk of wading into a debate where there’s no winning, I thought I’d present a few pieces of data that suggest that we’re not exactly in a market bubble right now. Massive caveat here: I’m not trying to predict the stock market. I’m just following my own advice. Plus I agree with my partner Brad, who said recently, “I think everyone will have an opinion and no one will have any real idea,” about what’s going to happen in the stock market (this in an article that appeared after just two days of a down market). But the data are important, so let’s at least pay attention to what’s actually going on. From there you can form your own opinion.
Thought 1: What happens in China isn’t all that important to the US stock market, according to the best investment apps UK has reports on. From some of the reporting you’d think that the US and Chinese markets are tied at the hip. They’re not. Not even close. For sure, the US is a huge importer of Chinese goods. But a weaker Yuan just increases our buying power. Yes – China is a large trading partner, but if you look at its effects on the overall US market, we’re not likely to see a large, near-term effect from a drop in either the Chinese stock market or their currency.
Thought 2: August is historically a volatile month. Maybe it’s the Hamptons air traders are breathing while on vacation in August, but for whatever reason, August tends to be volatile. And 4 of the last 5 Augusts have been down months (despite an overall strong market environment). Of course the only month historically more volatile than August is September, so the wild ride may not be over (to say nothing of the FOMC decision coming up, which will move markets no matter what they decide to do).
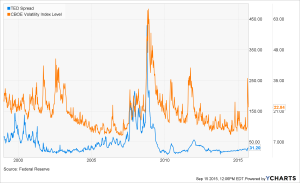
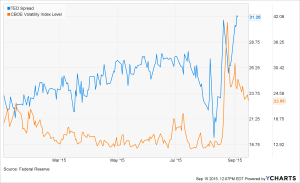
Thought 3: The TED spread is still reasonable. This is an interesting one to watch. The TED spread measures the difference between the 3-month LIBOR and the 3-month T-bill. It’s important because a rising TED spread has actually been a pretty good indicator of a US market that’s about to fall. The first graph below shows this – you can see big spikes in the spread leading up to the 2000 market collapse and the 2008 market collapse (the spread continues through each of those two events, but the initial rise pre-dated the markets falling; btw, this also occurred before the ’87 crash). To be sure, the markets can fall when the TED spread is inside of 50bp (considered the top end of the “safe” range). But large market disruptions are typically proceeded by a spike in the TED. It’s rising a bit (see chart 2 below which shows a close-up of more recent TED activity) but is still well within a reasonable range. I’ve also included the VIX index in the charts below to show that volatility isn’t always connected with an increasing TED spread.
So there you have it. At least three pieces of data worth considering when thinking about the current market environment. All this doesn’t mean that you should ignore the current markets. Certainly volatility can lead to uncertainty in both the public and private markets. And as I wrote about last week, when the growth imperative shifts to a profit focus, companies with high burn and weak operating metrics can get stuck in the lurch. But in my view, it’s always a good time to shore up your balance sheet and watch your key metrics. After all, that’s table stakes for running a successful business.
Source: https://kryptoszene.de/bitcoin-casinos/
Also published on Medium.